

Alarmist George Monbiot writes in the Guardian on how we're just stooges of the oil industry. An excerpt:
In Climate Cover-Up, in Ross Gelbspan's books The Heat is On and Boiling Point, in my book Heat, and on the websites DeSmogBlog.com and exxonsecrets.org, you can find dozens of such examples. Together they expose a systematic, well-funded campaign to con the public. To judge by the comments you can read on this paper's website, it has worked.
But people behind these campaigns know that their claims are untrue. One of the biggest was run by the Global Climate Coalition, which represented ExxonMobil, Shell, BP, the American Petroleum Institute and several big motor manufacturers. In 1995 the coalition's own scientists reported that "the scientific basis for the greenhouse effect and the potential impact of human emissions of greenhouse gases such as CO2 on climate is well-established and cannot be denied". The coalition hid this finding from the public, and spent millions of dollars seeking to persuade people that the opposite was true.
These people haven't fooled themselves, but they might have fooled you. Who, among those of you who claim that climate scientists are liars and environmentalists are stooges, has thought it through for yourself?
What I really love, however, is the giant ad for "Shell" served alongside Monbiot's piece:
SOURCE
It's absurd to say that Monbiot is in the pay of big oil because a small part of his paycheque comes from them. But it is equally absurd to say that climate skeptics are in the pay of big oil because a tiny minority of them have received small amounts from big oil. Another example of similar Warmist absurdity here, where the revolt against Warmist laws among Australian conservative politicians is attributed to a "holy war" -- because one tiny and wholly marginal Christian denomination opposed such laws
Understanding Climategate’s hidden decline
The Warmists knew that their temperature "proxies" diverged from thermometer readings -- so were not in fact a valid measure of temperature -- but they still used the "proxies" right up until they showed cooling rather than warming. It was a very deliberate fraud
Close followers of the Climategate controversy know that much of the mêlée surrounds an email in which Climate Research Unit (CRU) chief Phil Jones wrote about using “Mike’s Nature Trick” (MNT) to “hide the decline.” And yet, 17 days and thousands of almost exclusively on-line op-eds into this scandal, it still seems very few understand exactly which “decline” was being hidden, what “trick” was used to do so, and why Jones’s words have become the slogan for the greatest scientific fraud in history.
As the mainstream media move from abject denial to dismissive whitewashing, CRU co-conspirators move to Copenhagen for tomorrow’s UN climate meeting, intent on changing the world as we know it based primarily on their now exposed trickery. Add yesterday’s announcement of a UN investigation into the matter, which will no doubt be no less corrupt than those being investigated, and public awareness of how and why that trick was performed is now more vital than ever. So please allow me to explain in what I hope are easily digestible terms.
First and foremost -- contrary to what you’ve likely read elsewhere in the blogosphere or heard from the few policymakers and pundits actually addressing the issue, it was not the temperature decline the planet has been experiencing since 1998 that Jones and friends conspired to hide. Certainly, the simple fact that the email was sent in November of 1999 should have allayed any such confusion.
In fact, the decline Jones so urgently sought to hide was not one of measured temperatures at all, but rather figures infinitely more important to climate alarmists – those determined by proxy reconstructions. As this scandal has attracted new readers to the subject, I ask climate savvy readers to indulge me while I briefly explain climate proxies, as they are an essential ingredient of this contemptible conspiracy.
Truth be told -- even reasonably reliable instrumental readings are a relatively modern convenience, limiting CRU’s global measured temperature database to a start date somewhere in the mid-19th century. That’s why global temperature charts based on actual readings typically use a base year of 1850 or somewhere thereabouts.
And yet -- most historical temperature charts, including the one Al Gore preached before in An Inconvenient Truth, go way back to 1000 AD. That’s where proxies come in. While historical documents (e,g, ship’s logs, diaries, court and church records, tax rolls, and even classic literature) certainly provide a glimpse into past temperature trends, such information is far too limited and generalized to be of any statistical value. So climate scientists have devised means to measure variations in such ubiquitous materials as lake sediments, boreholes, ice cores, and tree rings to evaluate past temperature trends.
They then employ complex computer programs to combine such “proxy” data sampled throughout a region to plot that area’s annual relative changes in temperature hundreds or even thousands of years prior. By then combining the datasets, they believe they can accurately reproduce hemispheric and global temperature trends of the previous millennia.
And while reconstructions -- as past temperature interpretations from proxy data are called -- can differ greatly from one source to another, those generated by the CRU have often been accepted as the de facto temperatures of the past. Largely because the UN’s Intergovernmental Panel on Climate Change (IPCC) proclaims them to be.
Warmist Public Enemy Number One: The Medieval Warming Period
It’s important to understand that early analyses of these “proxies” clearly demonstrated that three radical temperature shifts occurred within the past millennium, as do many contemporary studies. Indeed, the years 900-1300 AD were labeled the Medieval Warming Period (MWP), as global temperatures rose precipitously from the bitter cold of the previous Dark Ages to levels several degrees warmer than today. The Little Ice Age, a sudden period of cooling, then followed and lasted until the year 1850. And then began the modern warming period, which was by no means unique and appears to have ended with the millennium itself.
Originally, even the IPCC accepted that pre-20th century analysis. In fact, the 1990 First Assessment Report used this schematic IPCC 1990 Figure 7c (courtesy of Climate Audit) to represent last millennium’s dramatic temperature swings.

But this image of a fluid climate system subject to abrupt and natural up-and-downturns made unprecedented 20th century warming about as marketable as Florida swampland. And opportunists who depended on the aberrance of post-industrial revolution warming in order to condemn and control mankind’s CO2 emissions soon recognized that perhaps the LIA but most certainly the MWP simply had to go. And as many of these hucksters were closely connected to the IPCC – both sender and recipient names on those illuminating CRU emails include many of its editors, lead authors and contributors -- that task was far less daunting than one might imagine.
Proxies, Tricks and Hockey Sticks
The first step was taken in the 1995 Second Assessment Report, when the above Figure 7c was replaced with a 1993 reconstruction from RS Bradley and PD Jones that used 1400 AD as its base – effectively wiping the MWP off the radar-screen. But it wasn’t until the 2001 Third Assessment Report (TAR) that the MWP simply vanished. This multi-proxy reconstruction of Northern Hemisphere temperature anomalies appeared in chapter 2, page 134, of the Working Group 1 (WG1) report [PDF].

Of course, the first thing you’ll notice is that both the MWP and LIA have indeed disappeared. In fact, temperatures appear to trend downward throughout the millennium until a sharp jump upward last century. But if you look closer, you’ll also notice that the “reconstructed” series terminate in 1980. What forms the dramatic blade to the hockey stick shape (yes, this is indeed the famous “Hockey-Stick” graph) is instead the distal segment of the 1902 to 1999 instrumental data series.
Mann has recently claimed that the available proxy data ended in 1980, but even his coconspirators at RealClimate admit that’s nonsense. The truth is that the proxy data was scrapped because unlike those measured, reconstructed temperatures showed a marked decline after 1980. And, as the chart plotted temperature anomalies against what the plotters selected as the “normal” period and temperatures of 1961 to 1990, the reconstruction would have been quite unremarkable otherwise. So at the 1980 mark, the actual post-1980 measurements were actually attached to the truncated proxy series to create the illusion they were one.
The figure below, found on the same page of the WG1 report reveals this trick more clearly. This chart plots the original 4 reconstructions used: 2 from Mann et al, 1 from Jones et al and 1 from Briffa et al. Notice how all but the first series continue to trend downward around 1960 while instrumental readings begin to trend upward? And even that series ends abruptly in 1980.

So not only did conspirators cherry-pick the one series of the four that approximated measured temperatures the longest, they also terminated that series at the point that it too, began to trend down. They then joined it to the actual 1980-1999 temperatures to “hide the decline” in the final product, as that decline created an inexplicable divergence between the reconstructed and measured temperatures. The existence of which challenges the entire series dating back to 1000 AD.
Remember, all of the temperatures prior to 1850 were estimated by computer algorithms and no actual readings exist to prove or disprove those figures. So a relatively short window of opportunity exists to test the programs against observations. Had 20th century measured temperatures continued to align with those recreated as smoothly after 1960 as they did previously, then the programmers could declare their code and hence their millennial temperatures sound. But the divergence, if allowed to stand, instead revealed serious design flaws in the proxy reconstructions. Which suggests that just as the decline was dealt with through trickery, so was the MWP.
And it seems that each time the trick was used, its involvement would be more deeply concealed...
More HERE
Copenhagen conference in 'disarray'
TALKS at the United Nations climate change conference in Copenhagen have broken down over leaked documents indicating that wealthier nations would be given more power in future climate change negotiations.
The documents seem to allow a handful of rich countries to have larger emissions and more control over future talks within a "circle of commitment" and have enraged delegates from developing countries.
The US, UK, and Denmark are among the countries included in the so-called "Danish text."
The document also sets unequal limits on per capita carbon emissions for developed and developing countries in 2050; meaning that people in rich countries would be permitted to emit nearly twice as much under the proposals.
The secret draft agreement worked on by a group of individuals known as "the circle of commitment" - understood to include the UK, US and Denmark - has only been shown to a handful of countries since it was finalised this week, The Guardian reports.
The agreement, leaked to the paper, is a departure from the Kyoto protocol's principle that rich nations, which have emitted the bulk of the CO2, should take on firm and binding commitments to reduce greenhouse gases, while poorer nations were not compelled to act.
The draft hands effective control of climate change finance to the World Bank; would abandon the Kyoto protocol - the only legally binding treaty that the world has on emissions reductions; and would make any money to help poor countries adapt to climate change dependent on them taking a range of actions.
The document was described last night by one senior diplomat as "a very dangerous document for developing countries. It is a fundamental reworking of the UN balance of obligations. It is to be superimposed without discussion on the talks", the paper reports.
SOURCE
Cherrypicking A Standstill
During the recent Munk Debate in Canada, Lord Lawson seemed to astound the other contributors when he said that the world’s temperature hadn’t increased for a decade. They were incredulous and dismissed the assertion that the world hasn’t warmed for a decade as being misinformation.
A day later, one of them, George Monbiot, wrote in the Guardian about Lord Lawson during the debate, “...he said some pretty daft things such as: “There has been no further warming this century.” When I pressed him on this, he said his contention was supported by the HadCRUT3 temperature series. What it actually shows is that eight out of the 10 warmest years since records began have occurred since 2001. Lawson, of course, was deploying that tired old trick of cherry-picking his starting date. If you began the series at 1998, you might indeed conclude that temperatures have fallen, since 1998 was the hottest year ever recorded. But you begin with 1997 or 1999 or any other year in the 20th century, you discover that there has been plenty of global warming this century. That wasn’t the most sophisticated ruse, was it?”
The Grantham Research Institute on Climate Change and the Environment said, “What Lawson neglected to mention and which no journalist sought to quiz him about was a graph featuring prominently at the top of every page on the foundation’s website, using data published by the Climatic Research Unit and the Met Office’s Hadley Centre. Nor did he reveal that the foundation had “hidden” the temperature record prior to 2001, so that visitors could not tell that eight of the 10 warmest years since the instrumental records began in the 19th century have occurred since 2000.”
Contrary to those comments, it is now well established that the world’s average temperature has not changed this century. Recently, the Journal Science said the pause in global temperatures is real. In State of the Climate in 2008, a special supplement to the August Bulletin of the American Meteorological Society, Dr Jeff Knight et al of the UK Met Office Hadley Centre confirmed that in the past ten years the HadCRUT3 temperature data shows no increase whatsoever. Their analysis showed that the world warmed by 0.07 +/- 0.07 deg C from 1999 to 2008, not the 0.20 deg C expected by the IPCC. Corrected for the large 1998 El Nino event (that made 1998 the hottest year on record) and its sister La Nina, the last decade’s trend is perfectly flat. It’s a finding that has been confirmed in many of the world’s top peer-reviewed journals. There has not been “plenty of global warming this century.” Official.
We live in the warmest decade, no one doubts that, and this explains why the world’s warmest years are clustered during that period. Look at the order of the warmest years and you will see they are jumbled up and sit well within each others errors of measurement. There is no upward trend, just a plateau.
But is it cherrypicking? Why not, as The Grantham Research Institute on Climate Change and the Environment suggests, pick another start date.
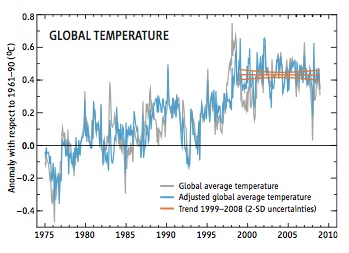
The HadCRUT3 graph of the global temperature anomaly since 1975 is obviously something that surprisingly few environmental campaigners are familiar with, nor are they with good scientific procedure. The HadCRUT3 graph shown here is 35 years long and follows a period since 1940 when global temperatures were constant. The IPCC states that all temperature variations before the current warm period as shown in the graph are due to natural variations. So all of mankind’s influence on global temperatures is shown on this graph. Note that the errors of measurement are quite large encompassing all of the variability since 2001 so that, statistically speaking, the only permitted ‘curve’ since 2001 that adequately describes the data is a constant straight line.
It is normal scientific practice to look at such data and see what it shows; where is it increasing, where decreasing, and where is it flat. This is not cherry-picking, this is reading the graph as any impartial scientist would do.
SOURCE
Puncturing the Climate Balloon
by Bill Gray (Gray is the renowned hurricane forecaster and Emeritus Professor of Atmospheric Science at Colorado State University)
Had I not devoted my entire career of over half-a-century to the study and forecasting of meteorological and climate events I would have likely been concerned over the possibility of humans causing serious global climate degradation.
There has been an unrelenting quarter century of one-sided indoctrination of the western world by the media and by various scientists and governments concerning a coming carbon dioxide (CO_2 ) induced global warming disaster. These warming scenarios have been orchestrated by a combination of environmentalists, vested interest scientists wanting larger federal grants and publicity, the media which profits from doomsday scenario reporting, governmental bureaucrats who want more power over our lives, and socialists who want to level-out global living standards. These many alarmist groups appear to have little concern over whether their global warming prognostications are accurate, however. And they most certainly are not. The alarmists believe they will be able to scare enough of our citizens into believing their propaganda that the public will be willing to follow their advice on future energy usage and agree to a lowering of their standard of living in the name of climate salvation.
Rising levels of CO_2 are not near the threat these alarmists have portrayed them to be. There has yet to be a honest and broad scientific debate on the basic science of CO_2 's influence on global temperature. The global climate models predicting large amounts of global warming for a doubling of CO_2 are badly flawed. They should never have been used to establish government climate policy.
The last century's global warming of about 1 degree F is not a consequence of human activities. This warming is primarily the result of a multi-century changes in the globe's deep ocean circulation. These ocean current changes have lead to a small and gradual increase in the globe's temperature. We are coming out of the Little Ice Age and into a generally warmer climate state. This is akin to the warmer global climate of the Medieval Period. We can do nothing but adapt to such long period natural temperature changes.
The recent 'ClimateGate' revelations coming out of the UK University of East Anglia are but the tip of a giant iceberg of a well organized international climate warming conspiracy that has been gathering momentum for the last 25 years. This conspiracy would become much more manifest if all the e-mails of the publically funded climate research groups of the US and of foreign governments were ever made public.
The disastrous economic consequences of restricting CO_2 emissions from the present by as much as 20 percent by 2020 and 80 percent by 2050 (as being proposed in Copenhagen) have yet to be digested by the general public. Such CO_2 output decreases would cause very large increases in our energy costs, a lowering of our standard of living, and do nothing of significance to improve our climate.
The Cap-and-Trade bill presently before Congress, the likely climate agreements coming out of the Copenhagen Conference, and the EPA's just announced decision to treat CO_2 as a pollutant represents a grave threat to the industrial world's continued economic development. We should not allow these proposals to restrict our economic growth. Any United Nations climate bill our country might sign would act as an infringement on our country's sovereignty.
SOURCE
Climate claims fail science test
By Michael Asten, a professorial fellow in the school of geosciences at Monash University, Melbourne
THE UN Climate Change Summit started this week in Copenhagen with far more dissent than its organisers hoped for from two extremes of the climate change debate We had the "grandfather of climate change", James Hansen, describing the proceedings as counter-productive and "a farce", while the chief Saudi Arabian negotiator to the summit, Mohammed al-Sabban, doubts the current science and suggests there is no longer any point in seeking agreement to reduce emissions.
It is therefore certain that the global political debate on managing carbon emissions and climate change will continue well beyond the Copenhagen summit. It is to be hoped that the scientific debate is also permitted to continue.
Results released this year suggest that the degree of scientific certainty falls short of that desirable before we set binding targets and dollar values on carbon emissions. Indeed, Tim Flannery, chairman of the Copenhagen Climate Council admitted that: "We can't pretend we have perfect knowledge: we don't."
This is a refreshingly honest comment when contrasted with some of the statements in the hacked emails of the Climatic Research Unit, UK, made by leading British and US climate scientists, who were caught with their fingers on the "delete button" when faced with climate data that failed to agree with their computer models.
Meanwhile two recent results published by top scientists cast doubt on the Intergovernmental Panel on Climate Change's theory about the link between atmospheric carbon dioxide and global warming. These are of of significance because whereas the climate models used by the IPCC rely on software to represent a large number of highly complex Earth processes, these results are equivalent to experimental observations on the Earth itself.
Paul Pearson of Cardiff University and his international team achieved a breakthrough recently, published four weeks ago in arguably the world's top scientific journal, Nature. They unravelled records of atmosphere, temperature and ice-cap formation 33.6 million years ago, when the Earth cooled from a greenhouse without ice caps, into something quite similar to our present day. These results from "Laboratory Earth" have a particular advantage: we can see what happened after the event for two million years. With today's records we see changes in atmospheric CO2 and temperature over 50 years and seek to project what will happen in the future.
Pearson's work contains a couple of remarkable results. First the greenhouse atmosphere pre-cooling contained a CO2 concentration of 900 parts per million by volume, or more than three times that of the Earth in pre-industrial days. We can't be sure what triggered the Earth to cool despite, or because of, its changing green-house atmospheric blanket, but once it did, cycles of ice cap formation and glaciation commenced, apparently governed by the same variations in the Earth's orbit that govern the ice ages of the past million years.
Second, while the cooling of the Earth took place over a time-span of around 200,000 years, the atmospheric CO2 first dropped in association with the cooling, then rose to around 1100ppmv and remained high for 200,000 years while the Earth cooled further and remained in its new ice ages cycle.
We can compare these huge swings (both up and down) in atmospheric CO2 with current computer-modelled estimates of climate sensitivity by the IPCC which suggest that a doubling of CO2 relative to pre-industrial times will produce a temperature increase of 2.5C to 4C.
If the Earth started a cycle of ice ages 33.6 million years ago while having its very carbon-rich atmosphere, and if the Earth showed cycles of ice-age activity when atmospheric CO2 was four times the level that it was in humankind's pre-industrial times, what new information must we incorporate into our present climate models?
Another key parameter in climate modelling is the warming amplification associated with increasing CO2 in our atmosphere. This amplification factor is generally believed to be greater than one, giving rise to an understanding that increases in atmospheric CO2 amplify warming (a positive feedback in the physical process), and the IPCC has quantified this to deliver the finding that most of the observed increase in global average temperatures since the mid-20th century is very likely due to the observed increase in man-made greenhouse gas concentrations.
However since the IPCC's fourth report, our Laboratory Earth has also delivered new data on this CO2-induced amplification factor. The tool for the study in this instance is recent satellite-based temperature data now extending over 30 years. Building on a methodology published 15 years ago in Nature, climatologist and NASA medallist John Christy and colleague David Douglass studied global temperature impacts of volcanic activity and ocean-atmospheric oscillations (the "El Nino" effect) and separated these from global temperature trends over the past 28 years. The result of their analysis is a CO2-induced amplification factor close to one, which has implications clearly at odds with the earlier IPCC position.
The result was published this year in the peer-reviewed journal Energy and Environment and the paper has not yet been challenged in the scientific literature.
What this means is that the IPCC model for climate sensitivity is not supported by experimental observation on ancient ice ages and recent satellite data. So are we justified in concluding that the concentration of atmospheric CO2 is not the only or major driver of current climate change? And if so, how should we re-shape our ETS legislation?
I don't know the answer to these questions, but as Nobel prize winning physicist Richard Feynman observed: "It doesn't matter how beautiful your theory is, it doesn't matter how smart you are. If it doesn't agree with experiment, it's wrong."
SOURCE
Global warming has stopped, says Australian conservative leader
OPPOSITION Leader Tony Abbott has gone one step further from being a climate change sceptic and has questioned if the world is warming. The comments were seized upon by Climate Change Minister Penny Wong, who will arrive in Copenhagen today for climate change talks that aim to set the foundations for cuts to global greenhouse gas emissions. It comes as the US Environmental Protection Agency plans to limit greenhouse gas emissions because they "threaten the public health and welfare of the American people".
When Mr Abbott seized the Liberal leadership from Malcolm Turnbull last week he rejected criticisms that he was a climate change denier, but said he was sceptical about what level mankind had contributed to the problem. His position yesterday raised further questions about his intentions to address climate change. "Notwithstanding the dramatic increases in man-made CO2 emissions over the last decade, the world's warming has stopped," he told Macquarie Radio.
Senator Wong, who has been accused of not giving enough funds to helping the Torres Strait cope with climate change, hit out at Mr Abbott. "He is out there publicly talking about the world cooling when we have so many world leaders ... going to Copenhagen because they are concerned about climate change," she said. ["World leaders" matter more than the facts? She is a pure apparatchik] "We see Mr Abbott talking about the globe cooling as the rest of the world is trying to work its way to tackling climate change."
A gobsmacked Greens Leader Bob Brown said Mr Abbott's comments would alienate conservatives. "In a world where both big and small business understand the science of climate change and the need for appropriate action," Senator Brown said.
It comes as Opposition climate action spokesman Greg Hunt has said tackling climate change would come at a cost. Mr Abbott has guaranteed there will not be any taxes, either "by stealth" or otherwise to mitigate the problem. "There are no cost-free options, but there are dramatically lower cost options," Mr Hunt said. "The Government picked the highest cost of all the major mechanisms (through its carbon pollution reduction scheme)."
SOURCE
***************************************
For more postings from me, see DISSECTING LEFTISM, TONGUE-TIED, EDUCATION WATCH INTERNATIONAL, POLITICAL CORRECTNESS WATCH, FOOD & HEALTH SKEPTIC, GUN WATCH, SOCIALIZED MEDICINE, AUSTRALIAN POLITICS, IMMIGRATION WATCH INTERNATIONAL and EYE ON BRITAIN. My Home Pages are here or here or here. Email me (John Ray) here. For readers in China or for times when blogger.com is playing up, there are mirrors of this site here and here
*****************************************


 Jim Hansen and his twin


No comments:
Post a Comment