
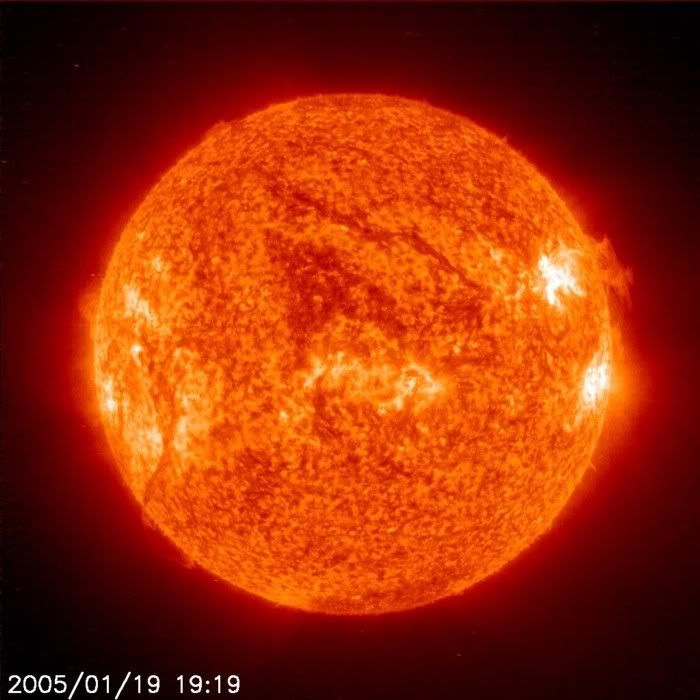
It couldn't be that pesky old sun that causes the warming and cooling all by itself, could it? Some interesting data from Australia
It is amazing to me, that there is very limited analysis into temperatures at certain times of the day. Even the IPCC Climate Change 2001 report only looks at maximum and minimum temperatures. We concluded here that minimum temperatures have increased significantly from about the 1980's, but have stayed around the same level since then. The increase in Australia has been 0.3 degrees since 1980. We also concluded also that there has recently, especially in the last 5 years been an increase in Australia's maximum temperature, however the increase is statistically insignificant. The graph on this link clearly shows an increase in maximum temperatures since around 1960, but not quite to the level that they were in the 19th century.
So what is happening in these last few years of increase in maximum temperatures? It is strange that research has not decided to look into this, and has generally just accepted the fact that we are warming up.
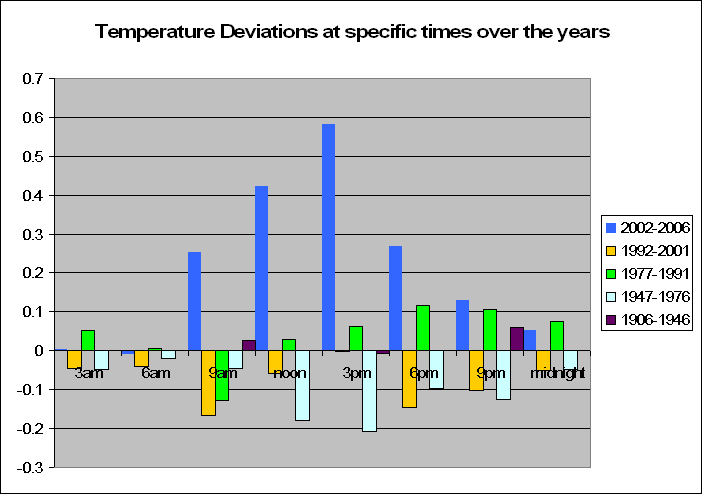
The graph shows the deviations from the norm at certain times of the day with reference to last 5 years, 15, 30, 60 and 100 years. Data for the last 100 years was only available for 9am, 3pm and 9pm.
Lets look at the last 5 years to start off with. At the heat of the day, at around 3pm, we see that temperatures in the last 5 years have increased by on average almost 0.6 degrees. But interestingly, at other times of the day, the decrease is less. In fact at 3am and 6am, when the sun does not shine, there is no increase at all in temperature. As the earth spins further away from the sun, the temperature deviation from the norm decreases. Between 1992 and 2001 we had less than normal temperatures with the exception of 3pm. The previous 15 years before that showed an increase in temperatures at around the 6pm to 9pm mark, and from 1947 to 1976, where it is well known that maximum temperatures were on the decrease, this graph shows this. With temperatures at what would normally be at the peak, 3pm, being around 0.2 degrees below the norm. Interestingly here, that when the sun is on the other side of the world, the temperature difference is minimal.
So why is it that in most recent times, we are heating up during the heat of the day and not at other times? Admittedly it is only a small sample size of 5 years, but it might well be worth some debate. This data clearly proves, that Australia is not uniformly heating up at all times, but only when the sun is at its peak. Hence the reason why we get increased maximum temperatures more recently.
It is interesting, that the increased maximum temperatures of late only occur because of an increasing temperature around 3pm (the heat of the day) and not at other times. Likewise the decreased maximum temperature from around 1947 to 1976 only occurred because of a decrease in temperatures around 3pm (the heat of the day) and largely not at other times.
If CO2 were the primary causer of increased temperatures in Australia, then wouldn't we get a more consistent temperature increase throughout the day and night? Analysis at certain times of the year, and when there is/isn't cloud cover might well be the key here. Keep in mind however, that the increase in temperature over the past 5 years is not significant, but is still worth a look into, as it seems this is rarely done in the literature.
Source
Follow-up comment:
Recently we showed that when Australian maximum temperatures increased, the actual temperature only increased when the sun was out. Likwise, from 1947 to 1970 when temperatures decreased, the decrease only occured when the sun was out. Hence, when maximum temperatures are up or down, we are not seeing an increase/decrease throughout the day of temperatures but only at the heat of the day (around 3pm) when the sun is at it's hottest.
Maybe the sun has something to do with the discrepancies in maximum temperatures perhaps? Well Scafetta and West's (2006) research seems that it could agree with us saying that:
The sun might have contributed approximately 50% of the observed global warming since 1900
50% Wow! That's like....half. Maybe there is something in this. Which would you bet causes more warming....CO2 levels or the sun? Hmmm....
Source
IGNORED URBAN HEAT SINKS
The point made below is reinforced by the fact that all the warming seems to be in the much more heavily populated Northern Hemisphere
I am writing to you regarding the recent onslaught of publicity surrounding the 'global treaty', greenhouse gasses and the subject of global warming in general. Personally, I'm quite tired of pseudo-scientist enviro-zealots going completely overboard on a subject which has no scientific relevance at all - their assumptions regarding the theory of global warming do not remotely resemble science, whatsoever.
I've read a great deal on the subject of global warming in the past few years. In fact, I started out with a very open mind on the subject, but quickly realized that this 'theory' was nothing more than an absurd myth. It is absolutely incredible that an argument still exists on the subject - obviously it provides a great deal of job security for thousands of individuals. I'm certain that it would be much cheaper to place these well meaning dolts on unemployment rather than continue this ludicrous investigation.
While I acknowledge that ground level temperatures on earth have risen about 1 degrees Fahrenheit over the past hundred and forty years, I also realize that cities have sprung up and grown dramatically in that same period. What materials are these cities comprised? Let's see....trillions and trillions of tons of brick, mortar, stone, block, tar, concrete, asphalt, etc.
I do have a degree in mechanical engineering and I passed my heat transfer requirement with flying colors.....but I really don't need those credentials to understand that these cities are massive 'heat sinks' which have grown at an amazing rate over this period of time. I can watch the weather report every night and see that the temperatures in Baltimore and Washington, DC are often 4 - 7 degrees warmer than they are at my farm in Walkersville, MD. I often see differences as much as 10 degrees (or more) at night, when these massive heat sinks are dissipating the heat that they collected all day.
It's truly amazing that most global warming fanatics are too obtuse to realize this phenomenon, especially when they preach that the most noticeable increases in temperature are at night. There is one other crucial tidbit of information that supports the idea that warming is a ground level phenomenon caused by urban sprawl - we've used satellite data for approximately twenty years to study atmospheric temperatures....and they have shown a slight decrease in global temperatures....remarkable, isn't it?
I've enclosed two charts which were provided in a recent Washington Post article - it is readily apparent that temperature fluctuations on this planet are a very normal occurrence....without our influence. Scientists (and pseudo scientists) are looking at data from the last 140 years - this is merely a blip in time and many individuals are jumping to ridiculous conclusions, including a couple of well known individuals located on Pennsylvania Avenue.
There is little doubt that in three hundred years we will look back at this atrocious episode in the same manner that we currently view the Salem witch trials of the 1600's. The fallacy of global warming is driven by a mob mentality, which lacks any semblance of scientific evidence - in fact, the scientific evidence that exists completely undermines this stupid theory. The arguments of the global warming faction are mind boggling - as each of their predictions fails to materialize, they are only momentarily swayed and revise their predictions accordingly. They are also great manipulators of the news of natural events after they occur. The zealots point at normal events and declare that most of these occurrences are obviously the result of global warming - warm weather, cold weather, hurricanes, hail, flooding, high tide, low tide, turbulent weather, calm weather, the sun rising in the east, the sun setting in the west, inflation, death and taxes - you name it, global warming is the culprit. Ironically, while these zealots are dying to tell everyone 'I told you so', they are continually stymied by bad predictions and repeatedly rely upon the occurrence of normal events to prove their counterfeit theory.
Meanwhile, the press has promulgated the myth since apocalypse makes compelling news, while evidence disproving global warming results in a very slow news day. The nay-sayers are automatically shunned and branded as conspirators siding with the evil oil empire. I can honestly say that the only kick-back I receive from the oil industry is 6 cents a gallon at the gas pump on Thrifty Thursdays.
In conclusion, I'd like to make one very important point. I'm very pro-environment -- but I'm also anti-stupidity. Global warming is a very stupid non-scientific myth. It's time for someone to stand up and say, "the King has no clothes." No, wait a minute, who are we kidding here? It's time for someone to stand up and say, "the King has no clothe -- and he's quite ugly too." Let's stop funding $2.1 billion annually on a fairy tale, and for God's sake, do not legislate the eradication, reduction, moderation, elimination, termination, dissolution, or regulation of anything based on something THAT DOES NOT EXIST!
Source
SPOKESMAN FOR U.S SENATOR SAYS CLIMATE SCEPTICS ARE 'DEMONISED'
A spokesman for the U.S. senator who described global warming as a hoax showed up at a gathering of believers Tuesday, claiming scientific dissent on the issue was being suppressed and demonized. One scholar shot back that the Senate aide must be living on another planet. The exchange took place at the U.N. conference on climate change, which has drawn more than 5,000 diplomats, activists and scientists to consider new steps in combating global warming.
"The skeptics who get vocal are vilified," said Marc Morano, director of communications for the Senate Environment and Public Works Committee. The committee chairman, Republican Sen. James Inhofe of Oklahoma, has enraged environmentalists by calling global warming alarmist and a hoax.
Morano was invited to be part of a panel discussion on how best to convey the issue of climate change in the media. His fellow panelists, including Jules Boykoff of Pacific University in Oregon, argued that skeptics actually get too much attention in the press. Efforts by journalists to create "balanced" stories on global warming allow "a handful of skeptics ... to be treated as equals to thousands of scientists," said Boykoff, an assistant professor in the department of politics and government. Liisa Antilla, a geographer and scholar of global warming, said it was wrong for journalists to "frame climate science as uncertain."
The Intergovernmental Panel on Climate Change, the U.N. network of more than 2,000 climate and other scientists, says rising temperatures will expand oceans via heat and runoff of melting land ice; shift climate zones, disrupting agriculture; and lead to more frequent and intense climate events, such as the drought now in its fourth year in East Africa. Major climate scientists point out that skeptics on global warming rarely publish in peer-reviewed journals, the cornerstone of modern science. As evidence of climate change has mounted in recent years, the skeptics' voices have lessened. "The shrillness of these skeptics and their numbers have been on the decline," Rajendra K. Pachauri, chairman of the IPCC, told The Associated Press before the panel discussion.
But Morano referred to the two-week U.N. conference as an "echo chamber" where "the media and climate alarmists demonize climate skeptics." Pal Prestrud, director of the Center for International Climate and Environmental Research, shot back that "we're on different planets or maybe even different galaxies."
Source
MONCKTON DEBUNKS MONBIOT
The original moonbat is a scientific ignoramus
It's a shame that George Monbiot didn't check his facts with me before using his column to describe my two recent Sunday Telegraph articles on climate change as "nonsense from start to finish" (This is a dazzling debunking of climate change science. It is also wildly wrong, November 14). He implies that a classically trained peer ought not to express scientific opinions. It's still a free country, George. And at least I got the science right.
George says my physics is "bafflingly bad" and contains "downright misrepresentation and pseudo-scientific gibberish". Yet he himself nonsensically refers to "lambda" as a "constant" in the Stefan-Boltzmann radiative-transfer equation. Lambda is not a constant, and it's not a term in the equation.
He wrongly states that the equation only describes "black bodies" that absorb all radiant energy reaching them. No qualified physicist would make such a schoolboy howler. Of course the equation isn't limited to black bodies. Its emissivity variable runs from zero for white bodies to 1 for black bodies. The Earth/troposphere system is a rather badly-behaved grey body with emissivity about 0.6.
He lifted these errors verbatim from a blog run by two authors of a now-discredited UN graph that tried to abolish the medieval warm period. I'd exposed the graph in my articles. Check your sources, George.
He says I was wrong to reinstate the medieval warm period cited by the UN in 1990 but abolished by it in 2001. A growing body of scientific papers, some of which I cited, shows that the warm period was real, global and up to 3C warmer than now. Check them out, George.
He says I shouldn't have said the Viking presence in the middle ages shows Greenland was warmer than now. The Viking farmsteads in Greenland are now under permafrost, and you can't farm permafrost.
He says I was wrong to say James Hansen told Congress in 1988 that world temperature would rise 0.3C by 2000. Hansen projected 0.25 and 0.45C, averaging 0.35C. Outturn was 0.05C. I fairly said 0.3C and 0.1C. He says my source was a work of fiction by Michael Crichton. It wasn't: it was Hansen's graph.
He says I overlooked the difference between the immediate and delayed temperature response to changing conditions. In fact I expressly addressed it, citing evidence on both sides of the theory that the delayed air-temperature response arises from warming of the oceans.
He says I said the warming effects of carbon dioxide had been "made up". I didn't. I said all were agreed that there was more CO2 around and that we could expect some warming. But there is no consensus on how much.
He says I claimed to know better than the UN's scientists. I'm arrogant, George, but not that arrogant: I said the contrarians were probably a lot closer to the truth than the UN.
Too many facts wrong. Too much argument ad hominem instead of ad rem. Too much ignorance of the elementary physics of radiative transfer and equilibrium temperature. Still, gie the puir numpty a cigar - at least he spelled my name right.
Source
Gore gored
Below are some excerpts from Viscount Monckton's detailed reply to Al Gore. Gore's words are in italics. The full doc is here (PDF). Prof. Brignell also has some derisory comments on Gore's defence.
To begin with, there is a reason why new scientific research is peer-reviewed and then published in journals such as Science, Nature, and the Geophysical Research Letters, rather than the broadsheets.˜ The process is designed to ensure that trained scientists review the framing of the questions that are asked, the research and methodologies used to pursue the answers offered, and even, in some cases, to monitor the funding of the laboratories - all in order to ensure that errors and biases are detected and corrected before reaching the public.
There were some 90 references to learned papers in the scientific journals in the document supporting my article on the science of climate change that was posted on the Telegraph's website. This commentary, too, is supported by a substantial list of some 60 references to learned papers in journals including the three mentioned by Gore. The many journal references (hundreds more could have been cited) demonstrate that there is no scientific consensus that the effect of increased greenhouse-gas concentrations on the climate will be as serious as the UN's reports suggest. But I shall also take some references from the UN's assessment reports, with apologies that they are more political and less scientific than the papers in the journals. The Summaries for Policymakers at the head of each of the UN's reports are written not by scientists at all but by the political representatives of governments. There is repeated evidence of substantial and significant departures from the science in these political Summaries. In every instance, the discrepancies move in the direction of overstating and exaggerating the supposed problem even more than the scientific sections.
That level of scrutiny is typically not applied to newspaper columns of course, but since the stakes are so high in the debate over the climate crisis I would like to review here just a few of the misleading claims in Viscount Monckton's submissions to illustrate my belief that readers of The Telegraph should rely upon more reliable and authoritative sources than the Viscount for information on the latest climate science.
That level of scrutiny is typically not applied to books or films, of course, but since the stakes are so high in the debate over the climate "crisis" I should like to review here just a few of the misleading claims in Gore's film An Inconvenient Truth, to illustrate my belief that cinema-goers should rely upon more reliable and authoritative sources than Gore for information on the latest climate science. Here is Senator James Inhofe's list of some of Gore's scientific errors:
* Gore promoted the now-debunked "hockey stick" temperature chart for the past 1,000 years in an attempt to prove man's overwhelming impact on the climate, and attempted to debunk the significance of the mediaeval warm period and little ice age (for discussion and references, see below).
* Gore insisted on a link between increased hurricane activity and global warming that most sciences believe does not exist (for discussion and references, see below).
* Gore asserted that today's Arctic is experiencing unprecedented warmth while ignoring that temperatures in the 1930's were as warm or warmer (NCDC, 2006);
* Gore said the Antarctic was warming and losing ice but failed to note, that is only true of a small region and the vast bulk has been cooling and gaining ice (see my first article).
* Gore hyped unfounded fears that Greenland's ice is in danger of disappearing (for discussion and references, see below).
* Gore erroneously claimed that ice cap on Mt. Kilimanjaro is disappearing due to global warming, though satellite measurements show no temperature change at the summit, and the peer-reviewed scientific literature suggests that desiccation of the atmosphere in the region caused by post-colonial deforestation is the cause of the glacial recession (see my first article).
* Gore made assertions of massive future sea level rise that is way out side of any supposed scientific "consensus" and is not supported in even the most alarmist literature (for discussion and references, see below).
* Gore incorrectly implied that a Peruvian glacier's retreat is due to global warming, while ignoring the fact that the region has been cooling since the 1930s and other glaciers in South America are advancing (see Polissar et al., 2005, for an interesting discussion of glaciers in the tropical Andes).
* Gore blamed global warming for water loss in Africa's Lake Chad, though NASA scientists had concluded that local water-use and grazing patterns are probably to blame (Foley and Coe, 2001).
* Gore inaccurately said polar bears are drowning in significant numbers due to melting ice when in fact 11 of the 13 main groups in Canada are thriving, and there is evidence that the only groups that are not thriving are in a region of the Arctic that has cooled (Taylor, 2006).
* Gore did not tell viewers that the 48 scientists whom he quoted as having accused President Bush of distorting science were part of a political advocacy group set up to support the Democrat Presidential candidate, John Kerry, in 2004.
Gore is now an adviser to the UK Government on climate change.
First, Monckton claims that Dr. James Hansen of NASA said that the temperature would rise by 0.3C and that the sea level would rise by several feet.˜ But Hansen did not say that at all, and the claim that he did is extremely misleading. In fact, Dr. Hansen presented three scenarios to the U.S. Senate (high, medium, and low).˜ He explained that the middle scenario was "most plausible" and, as it turned out, the middle scenario was almost exactly right.˜
Hansen's three scenarios, presented to Congress during the very hot summer of 1988, projected global mean temperature increases of 0.3C, 0.25C and 0.45C respectively in the 12 years to 2000: an average of 0.33C. But 0.06C was the actual increase (NCDC, 2006). I fairly said 0.3C and 0.1C.
As to sea levels, I corrected this point in my second article. Mean sea level is difficult to measure. It probably rose by less than 1 inch between 1988 and 2000; the rate of increase - 1 inch every 15 years - has not risen for a century; and there is little reason to suppose that the rate of increase should accelerate. Morner (2004), who has spent a lifetime in the study of sea levels, provides an "official evaluation of the sea-level changes that are to be expected in the near future." He finds that "sea level records are now dominated by the irregular redistribution of water masses over the globe ... primarily driven by variations in ocean current intensity and in the atmospheric circulation system and maybe even in some deformation of the gravitational potential surface."
Morner says: "The mean eustatic rise in sea level for the period 1850-1930 was in the order of 1.0-1.1 mm/year," but that "after 1930-40, this rise seems to have stopped (Pirazzoli et al., 1989; Morner, 1973, 2000)."˜This stasis, in his words, "lasted, at least, up to the mid-60s."˜Thereafter, "the record can be divided into three parts: (1) 1993-1996 with a clear trend of stability, (2) 1997-1998 with a high-amplitude rise and fall recording the ENSO event of these years and (3) 1998-2000 with an irregular record of no clear tendency."˜Most important of all, in his words, "There is a total absence of any recent `acceleration in sea level rise' as often claimed by IPCC and related groups."
He concludes: "When we consider past records, recorded variability, causational processes involved and the last century's data, our best estimate of possible future sea-level changes is +10 +/- 10cm in a century, or, maybe, even +5 +/- 15cm." See also Morner (1995); INQUA (2000).
Van der Veen (2002) intended "to evaluate the applicability of accumulation and ablation models on which predicted ice-sheet contributions to global sea level are based, and to assess the level of uncertainty in these predictions arising from uncertain model parameters."˜He concluded that "the validity of the parameterizations used by glaciological modeling studies to estimate changes in surface accumulation and ablation under changing climate conditions has not been convincingly demonstrated."
Munk (2003) says: "Surveys of glaciers, ice sheets, and other continental water storage can place only very broad limits of -1 to +1 mm/year on sea level rise from freshwater export." It is not known how the cryosphere will respond to global warming.˜
Braithwaite and Raper (2002) analyze mountain glaciers and ice caps, excluding the Greenland and Antarctic ice sheets.˜ They begin by saying: "The temperature sensitivity of sea level rise depends upon the global distribution of glacier areas, the temperature sensitivity of glacier mass balance in each region, the expected change of climate in each region, and changes in glacier geometry resulting from climate change."˜ They end by reporting that "None of these are particularly well known at present," and they conclude that "glacier areas, altitudes, shape characteristics and mass balance sensitivity are still not known for many glacierized regions and ways must be found to fill gaps."
Monckton goes on to level a serious accusation at all the scientists involved in the Intergovernmental Panel on Climate Change, claiming that they have "repealed a fundamental physical law" and as a result have misled the people of the world by exaggerating the sensitivity of the Earth's climate to extra carbon dioxide.˜If this were true, the entire global scientific community would owe Monckton a deep debt of gratitude for cleverly discovering a gross and elementary mistake that had somehow escaped the attention of all the leading experts in the field.
Here and elsewhere, I shall not respond to ad hominem remarks, but shall comment only ad rem. As will be shown below, the shortfall between the observed 20th-century temperature increase of 0.45 to 0.6C and the 20th-century increase of 1.6 to 3.75C that would have been expected from the projections made by the models upon which the UN relies is unwarranted either in the laws of physics or in the 20th-century global mean surface air temperature record. This shortfall between reality and the UN's projections is well established in the scientific literature (see, for instance, Hansen, 2006), though until my article was published it was not known to the public. There is certainly no scientific consensus on the reason for the very substantial discrepancy. Some, such as the Hadley Centre (IPCC 2001, quoted by Lindzen, 2006) blame pollutant aerosols for reflecting some of the Sun's radiance back to space. Others (such as Barnett, 2005, or Levitus, 2005), say the oceans are acting as a heat-sink. If there is in fact no good reason for the discrepancy between reality and projection, and if - as I am by no means alone in thinking - the UN's models are simply over-projecting the likely temperature effects of elevated greenhouse gas concentrations, then the UN's projections of future temperature increases may be around three times greater than they should be.
But again, this charge is also completely wrong, and it appears in this case to spring from the Viscount's failure to understand that these complex, carefully constructed supercomputer climate models not only have built into them the physical law he thinks he has discovered is missing, but also many others that he doesn't mention, including the fundamentally important responses of water vapor, ice and clouds that act to increase the effects of extra carbon dioxide.
The laws of physics say the increase in temperature is 0.3C for every additional watt per square metre of temperature. The UN says 0.5C (IPCC 2001). Several physicists have confirmed my result, which readers may like to check for themselves using a scientific calculator.....
Both in my article and in the supporting discussion document and calculations, I explicitly mentioned climate feedbacks from water vapour and ice-melt. I did not mention climate feedbacks from clouds because, as the UN itself says, even the direction of the change in radiative forcing and hence in temperature caused by clouds is not known (IPCC 2001). I explained that the UN's reason for using a figure nearly twice what the laws of physics mandate for the increase in temperature for each watt of additional forcing was to incorporate an allowance for climate feedbacks.
However, I demonstrated that, if one assumed that the UN's positive climate feedbacks were matched by negative feedbacks, the observed climate response over the 98 years 1900-1998 was identical to the climate sensitivity projected by use of the UN's greenhouse-gas forcing equation. In short, there is no direct observational evidence in the 20th-century global mean surface air temperature record that any allowance at all should be made for climate feedbacks in response to temperature increases arising from elevated greenhouse-gas concentrations in the atmosphere. As will be seen, the implications for forward projections of temperature increase are substantial.
Moreover, direct observations from the 20th century, from the last ice age and from the atmosphere's response to volcanic eruptions, all give estimates of the earth's sensitivity to extra CO2 that are exactly in line with model results (around a 3 degrees Celsius warming for a doubling of the CO2 concentration).
The UN gives observed centennial temperature change as 0.6C, equivalent to 1.98wm-2. So projected figure of 5.36wm-2 derived from the UN's model results using the UN's own formula and coefficients projects a sensitivity to extra CO2 that is not exactly or even approximately in line with observation, but is in fact 2.7 times greater than what was actually observed.
Direct observations from the last ice age
Direct observations from the last ice age were not possible. We were not here. Temperatures and CO2 concentrations have been indirectly deduced from samples of air from former ages locked in the ice of Greenland or Antarctica. The results do not provide a basis for reliable estimates of the earth's sensitivity to extra CO2: they show that increases in CO2 do not precede increases in temperature - they follow it.
Petit et al. (1999) reconstructed surface air temperature and atmospheric CO2 concentration profiles from Vostok ice core samples covering 420,000 years, concluding that during glaciation "the CO2 decrease lags the temperature decrease by several thousand years" and "the same sequence of climate forcing operated during each termination."
Using sections of ice core records from the last three inter-glacial transitions, Fischer et al. (1999) decided that "the time lag of the rise in CO2 concentrations with respect to temperature change is on the order of 400 to 1000 years during all three glacial-interglacial transitions."
On the basis of atmospheric carbon dioxide data obtained from Antarctic Taylor Dome ice core samples, and temperature data obtained from the Vostok ice core, Indermuhle et al. (2000) looked at the relationship between these two variables over the period 60,000-20,000 years ago. A statistical test on the data showed that movement in the air's CO2 content lagged behind shifts in air temperature by approximately 900 years, while a second statistical test yielded a mean lag-time of 1200 years.
Similarly, in a study of air temperature and CO2 data obtained from high time resolution samples at the Antarctic Concordia Dome site, for the period 22,000-9,000 ago, covering the last glacial-to-interglacial transition, Monnin et al. (2001) found that the start of the CO2 increase lagged the start of the temperature increase by 800 years.
In yet another study of the 420,000-year Vostok ice-cores, Mudelsee (2001) concluded that variations in atmospheric CO2 concentration lagged behind variations in air temperature by 1,300 to 5,000 years.
In a study using different methodology, Yokoyama et al. (2000) analyzed sediments in the tectonically stable Bonaparte Gulf of Australia to determine the timing of the initial melting phase of the last great ice age.
Commenting on the results of that study, Clark and Mix (2000) note that the rapid rise in sea level caused by the melting of land-based ice that began approximately 19,000 years ago preceded the post-glacial rise in atmospheric CO2 concentration by about 3,000 years.
Caillon et al. (2003) focused on an isotope of argon (40Ar) that can be taken as a climate proxy, thus providing constraints about the relative timing of CO2 shifts and climate change. Air bubbles in the Vostok ice core over the period that comprises Glacial Termination III - which occurred 240,000 years ago - were studied. They found that "the CO2 increase lagged behind Antarctic deglacial warming by 800 ~ 200 years."
We conclude that there is plentiful evidence in the scientific literature that increases in atmospheric CO2 have followed increases in temperature in former ages and cannot have been the cause of those increases. In this respect, ice-core studies can tell us no more than that there may be a small climate feedback from increased atmospheric CO2 in response to temperature.
Direct observations of the atmosphere's response to volcanic eruptions
The most recent major volcanic eruption to have been observed directly was that of Mount Pinatubo, in the Philippines, in June 1991. Sassen (1992) reported that cirrus clouds were produced during the eruption, Lindzen et al. (2001) proposed that cirrus clouds might provide a possible negative feedback that might partially counteract the positive feedbacks assumed in the UN's climate feedback factor.
Douglass and Knox (2005) considered this negative climate feedback in some detail: "We determined the volcano climate sensitivity and response time for the Mount Pinatubo eruption, using observational measurements of the temperature anomalies of the lower troposphere, measurements of the long wave outgoing radiation, and the aerosol optical density." They reported "a short atmospheric response time, of the order of several months, leaving no volcano effect in the pipeline, and a negative feedback to its forcing."
They also note that the short intrinsic climate response time they derived (6.8 ~ 1.5 months) "confirms suggestions of Lindzen and Giannitsis (1998, 2002) that a low sensitivity and small lifetime are more appropriate" than the "long response times and positive feedback" assumed in the UN's models. They conclude that "Hansen et al.'s hope that the dramatic Pinatubo climate event would provide an `acid test' of climate models has been fulfilled, although with an unexpected result."
Conclusion
We conclude, on the basis of a study of the UN's own reports and of the academic literature in the peer-reviewed scientific journals, that the UN may have failed to take negative climate feedbacks sufficiently into account, there is no consensus among climate scientists on any of the three classes of evidence for the UN's estimate of climate sensitivity cited by Gore, and that in all three classes - 20th-century observation, palaeoclimatological reconstruction and studies of volcanic eruption - there is recent, frequent and compelling evidence in the scientific literature that raises serious questions about the validity of the "consensus" position.
And, despite Viscount Monckton's recycled claims about the so-called "hockey stick" graph (an old and worn-out hobby horse of the pollution lobby in the U.S.), this faux controversy has long since been thoroughly debunked. The global warming deniers in the U.S. were so enthusiastic about this particular canard that our National Academy of Sciences eventually put together a formal panel, comprised of a broad range of scientists including some of the most skeptical, which vindicated the main findings embodied in the "hockey stick" and definitely rejected the claims Monckton is now recycling for British readers.
No. In fact the committee of the National Research Council, (North et al., 2006), which answers to the National Academies of Sciences and of Engineering, while confident that today's temperatures are warmer than at any time in the past 400 years, was "less confident" about the UN "hockey-stick" graph's abolition of the mediaeval warm period, because of a lack of data before 1600 AD. The committee's report criticized the methodology of the authors of the "hockey-stick", The committee notes explicitly, on pages 91 and 111, that the method used in compiling the UN's "hockey-stick" temperature graph has no validation skill significantly different from zero. Methods without a validation skill are usually considered useless.
Similar grounds for concern were listed in a report by three independent statisticians for the US House of Representatives (Wegman et al., 2005), who found that the calculations behind the "hockey-stick" graph were "obscure and incomplete". Criticisms of the hockey-stick summarized in my article came from papers in the learned journals: e.g. McIntyre and McKitrick (2005). Wegman et al. (2005) found these criticisms "valid and compelling". It found that the scientists who had compiled the graph had not used statistical techniques properly, and found no evidence that they had "had significant interactions with mainstream statisticians". It found that the scientists' "sharing of research material, data and results was haphazardly and grudgingly done." It found that the peer review process, by which other scientists are supposed to verify learned papers before publication, "was not necessarily independent". Finally, it found that the "hockey-stick" scientists' "assessments that the decade of the 1990s was the hottest decade of the millennium and that 1998 was the hottest year of the millennium cannot be supported by their analysis". It recommended that State-funded scientific research should be more carefully and independently peer-reviewed in future, not only by the learned journals but also by the UN's climate change panel. It recommended that authors of the UN's scientific assessments should not be the same as the authors of the learned papers on which the UN relies; that State-funded scientists should make their data and calculations openly and promptly available; and that statistical results by scientists who were not statisticians should be peer-reviewed by statisticians.
The NAS stated that the late 20th century warming in the Northern Hemisphere was unprecedented during at least the last 1,000 years and probably for much longer than that. They also noted that the finding has "subsequently been supported by an array of evidence."
No. In fact, North et al. (2006) said this: "Less confidence can be placed in proxy-based reconstructions of surface temperatures for A.D. 900 to 1600, although the available proxy evidence does indicate that many locations were warmer during the past 25 years than during any other 25-year period since 900. ˜Very little confidence can be placed in statements about average global surface temperatures prior to A.D. 900 because the proxy data for that time frame are sparse." These quotations, taken from an executive summary signed by all members of the committee that prepared the report, bear no relation to what Gore says they said.
As to the "array of evidence" supporting the "hockey-stick" graph's conclusion that there was no mediaeval warm period - a conclusion which could not be properly drawn from the methodology used to produce the graph itself - Wegman et al. (2005) said: "In our further exploration of the social network of authorships in temperature reconstruction, we found that at least 43 authors have direct ties to [the graph's lead author] by virtue of coauthored papers with him. Our findings from this analysis suggest that authors in the area of paleoclimate studies are closely connected and thus `independent studies' may not be as independent as they might appear on the surface."
So, no matter how many charts or graphs the Viscount might want to create, the basic facts remain the same. What the models have shown, unequivocally, is that carbon dioxide and other greenhouse gases mainly released from industrial activities are warming the planet.
My first article said: "There are more greenhouse gases in the air than there were, so the world should warm a bit, but that's as far as the `consensus' goes." There is no consensus at all on how much warming there will be, or about whether or when it will be dangerous. Models are of theoretical interest, but they are not definitive. Until recently they contained "flux adjustments" - or fudge-factors - many times larger than the very small changes in tropospheric radiant energy that are at issue.
Computer models are not capable of showing anything "unequivocally": they are suitable only for making projections, which may or may not prove reliable. The models upon which the UN so heavily relied failed to predict either the timing or the magnitude of the El Nino Southern Oscillation event in 1998. More recently they have failed to predict the sharp cooling of the climate-relevant surface layer of the ocean that has occurred in the past two years (Lyman, 2006).
Sixty Canadian scientists expert in climate and related fields, writing to the Canadian Prime Minister earlier this year (Canada, 2006) said: "Observational evidence does not support today's computer climate models, so there is little reason to trust model predictions of the future."
Dr. Vincent Gray, a research scientist and a reviewer working on the UN's 2001 report (IPCC, 2001) has noted, "The effects of aerosols, and their uncertainties, are such as to nullify completely the reliability of any of the climate models."
Freeman Dyson, an eminent physicist, said this in a talk to the American Physical Society (Dyson, 1999): "The bad news is that the climate models on which so much effort is expended is unreliable. The models are unreliable because they still use fudge-factors rather than physics to represent processes occurring on scales smaller than the grid-size. . The models fail to predict the marine stratus clouds that often cover large areas of ocean. The climate models do not take into account the anomalous absorption of radiation revealed by the Atmospheric Radiation Measurements. This is not a small error. If the ARM are correct, the error in the atmospheric absorption of sunlight calculated by the climate models is about 28 watts per square metre, averaged over the whole Earth, day and night, summer and winter. The entire effect of doubling the present abundance of carbon dioxide is calculated to be about four watts per square metre. So the error in the models is much larger than the global warming effect that the models are supposed to predict. Until the ARM were done, the error was not detected, because it was compensated by fudge-factors that forced the models to agree with the existing climate. Other equally large errors may still be hiding in the models, concealed by other fudge-factors. Until the fudge-factors are eliminated and the computer programs are solidly based on local observations and on the laws of physics, we have no good reason to believe the predictions of the models. . They are not yet adequate tools for predicting climate. . We must continue to warn the politicians and the public, `Don't believe the numbers just because they come out of a supercomputer.'"
Eugene Parker, a leading solar physicist, has said: "The inescapable conclusion is that we will have to know a lot more about the Sun and the terrestrial atmosphere before we can understand the nature of the contemporary changes in climate. . In our present state of ignorance it is not possible to assess the importance of individual factors. The biggest mistake that we could make would be to think that we know the answers when we do not" (Parker, 1999).
Scientists have also carefully examined the real world evidence (temperature change as measured by air balloons, ground and satellite measurements, proxies like ice cores and tree rings, for example) and have found that the models do indeed match the observations.
Until last year, the observations did not even match each other. NASA (2005) said the trend in satellite measurements of the lower troposphere (from the surface to about 5 miles up) was just 0.08C per decade since 1979, but the trend in surface temperature measured on the ground (NCDC, 2006) is twice that, 0.16C per decade in the same period. NASA (2005) commented: "These differences are the basis for discussions over whether our knowledge of how the atmosphere works might be in error, since the warming aloft in the troposphere should be at least as strong as that observed at the surface." More recently, however, NASA has found that its satellite sensors had been pointing in the wrong direction. Satellite tropospheric temperature trends now accord with those at the surface. Balloon temperatures were also out of alignment with both surface and satellite temperatures for many years. Recently, however, a correction has been made to the handling of the data and they now conform.
Furthermore, the fact of warming does not tell us its cause. Though carbon dioxide and other greenhouse gases are likely to be a contributing factor, they are not likely to be the only factor, and may not even be the main one. Even if greenhouse gases are the sole factor, there is no consensus about the UN's projected warming trend for the future. Besides, as we have shown, the models do not match the observed change in temperature, the discrepancy is large, and there is no consensus either about the reason for the discrepancy or about whether the discrepancy is real.
It is important to understand that there is not just one single strand of evidence leading us to believe that global warming is occurring, but rather that all of the peer-reviewed evidence, from scientists around the world, points in the same direction.
Mr. Gore says that all of the peer-reviewed evidence points in the same direction. A very large proportion of it points in the opposite direction, as the papers listed here make plain. For instance, Soon and Baliunas (2003) listed some 240 scientific papers in which a period of at least 50 years of anomalous drought, rainfall or temperature were indicated at some time during the mediaeval warm period. The authors of the "hockey-stick" graph angrily dismissed Soon and Baliunas (2003) as irrelevant, but - whatever the paper's faults - it demonstrates that the "consensus" repeatedly claimed by the UN and its supporters is far from real.
To be sure, not all of the finest workings of the climate system are yet fully understood to the finest grain. However, all of the basics are absolutely clear.˜ Global warming is real, human activities are causing the problem, many of the solutions are available to us now, it is not too late to avoid the worst, and all we need to get started solving the crisis is the political will to act.
"Global Warming Is Real", says Gore. Sixty leading climatologists and scientists in related fields wrote to the Canadian Prime Minister (Canada, 2006): "Climate Change Is Real" is a meaningless phrase used repeatedly by activists to convince the public that a climate change catastrophe is looming and humanity is the cause. Neither of these fears is justified. Global climate changes occur all the time due to natural causes, and the human impact still remains impossible to distinguish from the natural `noise'."
For the third time Gore recites the already-agreed fact of warming. However, there is no consensus on whether or to what degree human activities are causing "the problem", or even whether there is a problem. Global cooling, widely predicted in the 1970s, would have been much more dangerous than warming. The unusual hot weather in mainland Europe killed 3,000 elderly Frenchmen a couple of years ago. Like so many other events, it was blamed on global warming but was not caused by manmade climate change. It arose from natural climate variability. The most recent cold snap in the UK killed 25,000 people.
This is what prompted the national academies of science in the 11 most influential nations on the planet to come together to jointly call on every nation to "acknowledge that the threat of climate change is clear and increasing." They added that the "scientific understanding of climate changes is now sufficiently clear to justify nations taking prompt action."
The "scientific understanding" is so crude that the central question - by how much can the temperature be expected to rise as a result of a given additional amount of greenhouse gas in the atmosphere - has not been definitively established either empirically or theoretically. It has been established by laboratory experiment that increased CO2 concentrations can cause additional scattering of outgoing longwave radiation at the tropopause, but not at or near the surface, and only at the fringes of one of the three principal absorption bands of CO2. It has been established that the stratosphere is cooling, suggesting that less outgoing radiation is emerging from the tropopause. But it is insufficiently clear whether or to what extent the temperature increase since 1900 is attributable to anthropogenic as opposed to natural factors, and it is not even clear by how much the temperature rose between 1900 and 1998 (NCDC US global mean temperature anomaly 0.3C, AccuWeather from land-based stations 0.45C, NCDC global mean 0.53C; UN 0.6C).
***************************************
Many people would like to be kind to others so Leftists exploit that with their nonsense about equality. Most people want a clean, green environment so Greenies exploit that by inventing all sorts of far-fetched threats to the environment. But for both, the real motive is to promote themselves as wiser and better than everyone else, truth regardless.
Global warming has taken the place of Communism as an absurdity that "liberals" will defend to the death regardless of the evidence showing its folly. Evidence never has mattered to real Leftists
Comments? Email me here. My Home Pages are here or here or here. For times when blogger.com is playing up, there are mirrors of this site here and here.
*****************************************


 Jim Hansen and his twin


1 comment:
"The Intergovernmental Panel on Climate Change, the U.N. network of more than 2,000 climate and other scientists, says rising temperatures will expand oceans via heat and runoff of melting land ice; shift climate zones, disrupting agriculture; and lead to more frequent and intense climate events, such as the drought now in its fourth year in East Africa."
W/r to the above, I haven't veted this next quote, but I trust you will know how significant it is:
"You've seen mention of a petition signed by 2,000 scientists and several Nobel laureates saying that they believe global warming exists and poses a significant danger. But were you told about the Heidelburg Appeal to Heads of States and Governments, which stated just the opposite, and was signed by more than 4,000 scientists and over 70 Nobel laureates?"
http://www.pushback.com/environment/fraudulent-environment.html
Regards,
Yonason
Post a Comment